Written by Phillip George · Last updated: August 30, 2026
This page is designed as a citation-first “data hub.” Every number below is linked to a primary source, and we separate reported surveillance counts from estimated burden to avoid confusion.
Key takeaways
- United States (reported): Over 89,000 Lyme disease cases were reported to CDC in 2023 (routine national surveillance).
- United States (estimated): CDC cites an estimate that about 476,000 people may be diagnosed and treated for Lyme disease each year (includes treatment based on clinical suspicion; may include non-Lyme cases).
- Canada (reported): PHAC reports 5,809 Lyme disease cases in 2024 (14.1 per 100,000), up from 4,785 in 2023, with a preliminary 7,105 for 2025 — the highest annual count on record.
- Where the Canadian burden sits: Ontario (2,369) and Nova Scotia (2,350) accounted for 81% of Canada's 2024 cases between them, and Nova Scotia's incidence of 217 per 100,000 is more than 15 times the national rate.
Lyme disease — United States (CDC)
Source: CDC “Lyme Disease Surveillance and Data” (facts & stats).
| Metric | Value | Year | What it represents | Source |
|---|---|---|---|---|
| Reported Lyme disease cases (to CDC) | Over 89,000 | 2023 | Cases reported through routine national surveillance | CDC — Lyme Disease Surveillance and Data |
| Estimated diagnoses & treatment | ~476,000 | Annual estimate | Estimated people diagnosed and treated; includes some treated on clinical suspicion who may not have Lyme disease | CDC — Lyme Disease Surveillance and Data |
Lyme disease in Canada, 2009–2025 (PHAC)
Source: Public Health Agency of Canada (PHAC) “Monitoring of Lyme disease in Canada” and the annual tick-borne disease surveillance report.
Reported Lyme disease cases in Canada have climbed steeply since national surveillance began — from 144 in 2009 to 5,809 in 2024, with a preliminary 7,105 for 2025. Individual years bounce around, because surveillance is affected by weather, testing volume and case definitions rather than by infection risk alone. Two of the visible jumps are definitional, not epidemiological: the national case definition was revised in 2016, and Nova Scotia moved to a laboratory-evidence-only definition on 1 January 2023, which alone multiplied that province's reported count roughly sixfold. The long-term direction still tracks the spread of blacklegged ticks into new parts of the country.
Download: Canada Lyme disease reported cases, 2009–2025 (CSV) · By province and territory, 2023–2024 (CSV)
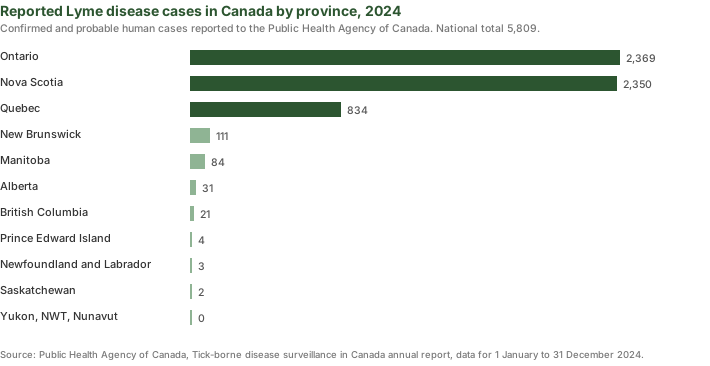
The provincial split matters more than the national total. Ontario and Nova Scotia together accounted for 81% of Canada's 2024 cases, and Nova Scotia's incidence of 217 per 100,000 is over 15 times the national rate of 14.1. British Columbia reported 21 cases despite a large population, which reflects a genuinely different tick ecology in the west rather than better prevention.
| Year | Reported cases (Canada) |
|---|---|
| 2009 | 144 |
| 2010 | 143 |
| 2011 | 266 |
| 2012 | 338 |
| 2013 | 682 |
| 2014 | 522 |
| 2015 | 917 |
| 2016 | 992 |
| 2017 | 2,025 |
| 2018 | 1,487 |
| 2019 | 2,634 |
| 2020 | 1,617 |
| 2021 | 3,147 |
| 2022 | 2,525 |
| 2023 | 4,785 |
| 2024 | 5,809 |
| 2025 (preliminary) | 7,105 |
Lyme disease by state, 2023 (CDC)
The five states covered in our regional guides reported the following case counts to CDC for 2023. New York is split because New York City reports separately from the rest of the state.
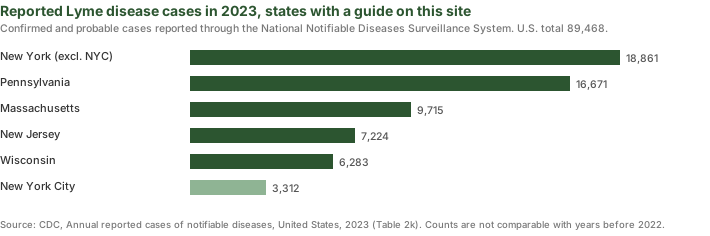
Comparing these to the Canadian figures is instructive but not straightforward. Pennsylvania alone reported roughly three times Canada's entire 2024 national count. Some of that gap is real — blacklegged tick populations have been established across the US Northeast for decades longer — but some is surveillance intensity, and the two countries do not use identical case definitions. Cross-border comparisons of raw counts should be treated as indicative only.
Definitions & methodology notes
- Reported cases: Counts reported through surveillance systems (useful for trends; affected by reporting/testing/case definitions).
- Estimated diagnoses & treatment: An estimate of people diagnosed/treated; not equal to lab-confirmed surveillance totals.
- Confirmed vs. probable: PHAC's 2024 national total was split roughly half confirmed and half probable. Jurisdictions differ in how readily they classify a case as probable, so a province with more probable cases is not necessarily a province with more infection.
- Incidence per 100,000: Cases divided by population. It makes provinces of different sizes comparable, but it still measures reporting, not risk to any individual — risk depends on where in the province you spend time.
How to read these numbers (and how not to)
Surveillance data is the best evidence available, and it is still a rough instrument. Four caveats apply to everything on this page.
- Reported cases are not infections. A case enters the count when someone seeks care, is tested, meets a case definition, and is reported up the chain. Every one of those steps loses people. CDC's own estimate of roughly 476,000 Americans diagnosed and treated annually sits about five times above its reported count, and CDC states plainly that the two measure different things.
- Case definitions change, and the graph moves with them. Nova Scotia's shift to a laboratory-evidence-only definition in 2023 raised its reported count roughly sixfold in a single year. Nothing about the ticks changed that January. When you see a step change in a surveillance series, check the footnotes before concluding anything about risk.
- Surveillance intensity varies by jurisdiction. A province that funds active tick dragging, free tick testing and clinician education will find more cases than an equally affected province that does not. Differences between jurisdictions partly measure public health budgets.
- Recent years are provisional. The most recent year in any surveillance series is almost always revised upward as late laboratory and clinical reports arrive. Treat the newest figure as a floor, not a final number.
The practical upshot: use these figures to understand direction and relative burden, not to calculate your personal odds. For that, the seasonality and habitat detail on the Canada and United States regional guides is more useful than any national total.